For France, eight values coexist, all sourced, all defensible: from 17.1 to 46.1 gCO₂e/kWh, a ratio of 2.7 between lowest and highest. The lowest, AIB's residual mix, belongs to market-based accounting; among location-based values alone, the ratio is 2.4. None of them is wrong. They simply answer different questions.
Three decisions settle the choice: the geographic boundary (production or consumption), the life-cycle boundary (combustion only or full assessment), and the nature of the factor (average or marginal). Tick all three boxes and one value is left. A fourth decision, the accounting convention (location-based or market-based, see the next chapter), explains the AIB row.
The eight French numbers, and what separates them
| Source | Value | Year | Geographic boundary | Life-cycle boundary |
|---|---|---|---|---|
| AIB, residual mix | 17.1 | 2025 | residual, after guarantees of origin are removed | direct CO₂ only |
| RTE | 19.6 | 2025 | production | combustion |
| RTE | 20.0 | 2025 | consumption | combustion |
| RTE | 29.0 | 2025 | production | LCA |
| Electricity Maps | 29.6 | 2025 | production | LCA |
| Electricity Maps | 32.0 | 2025 | consumption, flow-traced | LCA |
| Ember | 41.4 | 2025 | production | LCA |
| ADEME Base Carbone | 46.1 | 2025, smoothed 2022-2025 | consumption | LCA |
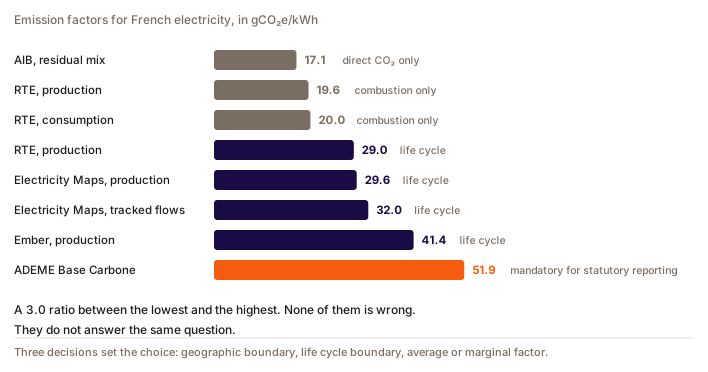
The gaps can be explained one by one. The distinction between the two accounting conventions is the subject of the next chapter.
From 19.6 to 29.0 at RTE, you add the upstream: building the plants, extracting the fuel, manufacturing the panels. Nuclear goes to 7 g, solar PV to 43 g, onshore wind to 16 g.
The gap between RTE and Ember, 29.0 to 41.4, comes from the per-technology factors, despite an identical declared boundary. Ember applies generic values from IPCC AR5 and UNECE, RTE applies French values. Hydro goes from 6 g at RTE to 24 g at Ember, bioenergy to 230 g.
At Electricity Maps, moving from 29.6 to 32.0 comes from flow tracing: France exported 99.63 TWh and imported 10.03 TWh in 2025, and imported electricity does not carry the French mix.
ADEME's 46.1 is a four-year smoothing that still includes 2022, a year of low nuclear availability. That smoothing makes reductions show up several years late.
AIB's 17.1, finally, is a residual mix: what is left once guarantees of origin have been removed and attributed to whoever bought them. It is low because 85.83% of that French residual is nuclear, and because it counts direct CO₂ only. It even falls below RTE's combustion figure for production: it keeps CO₂ alone, and it comes from a calculation that trades guarantees of origin, not from a production measurement. The 2025 edition does cover calendar year 2025. Do not compare it line by line.
A combustion-only factor counts just the CO₂ emitted by burning the fuel. An LCA factor adds the upstream: building the plant, extracting and transporting the fuel, manufacturing the equipment, decommissioning.
On a heavily nuclear mix the gap is huge in relative terms, since nuclear combustion is zero but its construction is not. In France, moving from combustion to LCA raises the factor from 19.6 to 29.0 g, up 48%. On a coal-heavy mix the relative gap is far smaller.
What the law requires, and what you choose
For a French regulatory inventory there is no debate: the ADEME factor is mandatory under article L229-25 of the French environment code, even though it is the highest in the table. The GHG inventory method issued for its application is explicit: for electricity, "the use of any other factor is prohibited" (our translation). For an inventory covering 2025, the value is 0.0461 kgCO₂e/kWh, smoothed over 2022-2025, with a declared uncertainty of 10%. ADEME added it to the Base Carbone in version 23.10, on 5 May 2026; the current version is 23.11, of 19 May 2026. An inventory covering 2024 keeps 0.0519, smoothed over 2021-2024. ADEME also announces a change of calculation method in 2027, which could push this factor up.
For comparing locations, on the other hand, the ADEME factor is unusable: it covers one zone only. You then need Electricity Maps or Ember, and you stick to it across every country compared. Mixing ADEME for France and Ember for Poland creates an artificial gap.
| Zone | 2024 | 2025 |
|---|---|---|
| Sweden | 34.89 | 35.34 |
| France | 40.46 | 41.44 |
| EU | 211.82 | 210.13 |
| Ireland | 270.77 | 263.30 |
| Chile | 260.92 | 290.60 |
| Germany | 339.87 | 334.12 |
| United States | 383.81 | 384.40 |
| World | 471.91 | 459.03 |
| Singapore | 498.68 | 497.05 |
| Poland | 608.47 | 590.89 |
| India | 707.10 | 671.41 |
Source: Ember, production, full LCA including upstream methane and manufacturing, in gCO₂e/kWh.
The France against Poland gap is 14 times at Ember and 21 times at Electricity Maps with flow tracing. That order of magnitude holds whatever the method, which is rare. It is the one that holds up best in discussion.
The granularity trap in the United States
The only official US source remains EPA eGRID2023, on a combustion-only basis, so structurally low compared with Ember or Electricity Maps on the same zones.
| eGRID subregion | gCO₂e/kWh |
|---|---|
| NYUP, Upstate New York | 110.1 |
| CAMX, California | 195.0 |
| SRVC, Virginia and the Carolinas | 270.5 |
| RFCE, PJM East | 271.8 |
| NWPP, Oregon | 288.2 |
| ERCT, Texas | 334.1 |
| RFCW, PJM West | 415.5 |
| MROW, Iowa and MISO North | 420.3 |
| US average | 349.7 |
A client who tells you "our servers are in PJM" has not given you the granularity of the factor. PJM covers among others RFCE at 271.8, RFCW at 415.5 and, for Northern Virginia, SRVC at 270.5 (eGRID2023, revision 2 of June 2025), so a factor of 1.5 in internal uncertainty depending on the exact location. eGRID subregions follow a NERC split, not PJM's zones. Factors at grid-operator level are not in eGRID: you have to go to the emissions data published by PJM and MISO, or filter the EPA Clean Air Markets Program by dispatch authority.
Average or marginal: what the GHG Protocol says
The distinction is not academic for a data centre, because the GHG Protocol sets the rule of use itself in its October 2025 consultation Consequential Electricity-Sector Emissions Impacts.
The operating margin is the average emission rate of the plants called at the margin of dispatch, excluding low-cost sources running as baseload. The build margin takes the average of the most recently installed 20% of capacity, renewables included.
The GHG Protocol reserves the operating margin for demand changes that are "discrete, temporary and small", and the build margin for changes that are "permanent and large". An AI data centre of several hundred megawatts falls in the second category, so in the build margin.
One national database publishes all three values with a detailed guide: India's CEA, version 21.0 of November 2025, financial year 2024-25, in tCO₂/MWh:
| Weighted average | Operating margin | Build margin | Combined margin |
|---|---|---|---|
| 0.710 | 0.961 | 0.512 | 0.736 |
A factor of 1.9 between operating and build margin. And the direction of the gap deserves attention: in a country installing renewables at scale, the build margin is lower than the operating margin.
Question
A client hosts an AI workload with a provider who simply declares "PJM region, United States". Which factor do you use?
Choisissez une réponse pour voir l'explication.
There is no emission factor for an AI request
Checked on 9 October 2026 in ADEME's Base Empreinte, version 1.2, which contains the Base Carbone: no "generative AI", "LLM request" or "token" entry exists among the 9,277 published datasets. The only per-request entry is the web request, at 1.23 gCO₂e over a fixed connection (2020 data), unrelated to a language model.
Since version 23.10 of 5 May 2026, the old "digital" factors are archived, including the 2014 "computer servers" entry. ADEME's digital database replaces them. The closest thing to AI usage is hardware: seven graphics cards, from 61 kgCO₂e for an Nvidia L4 to 149 kgCO₂e for an A100 PCIe, taken from the GPU life-cycle assessment ADEME published in March 2026, and servers, from 287 kgCO₂e for a small rack server to 5,487 kgCO₂e for a large one. These values cover manufacturing, transport and end of life. Electricity used in operation is not included and has to be added separately.
The base-carboner dataset published on data.gouv does not contain this data: it stopped at version 23.6 of July 2025, and the multi-criteria digital data only ships in the Base Empreinte export.
The UK DEFRA/DESNZ databases, the EPA GHG Emission Factors Hub and ecoinvent were not consulted for this work: their existence in a 2025 edition is confirmed indirectly, their content is not.
Practical consequence: calculating the footprint of AI usage from the French Base Empreinte alone means reconstructing consumption in kWh, then multiplying it by the electricity factor of the hosting country. The GPU and server entries add the manufacturing share, provided you estimate how much hardware the usage ties up. There is no official French shortcut, and the only per-request figures available are provider self-declarations on functional units that are incompatible with one another.
What to take away
Three questions settle the choice, in this order.
- Is this a regulatory inventory? Then the ADEME factor applies in France, however old it is.
- Are you comparing locations? Take a single database and stick to it across every country.
- Does the workload add permanent, large-scale demand to the grid? The GHG Protocol typology points to the build margin.
And one drafting rule that holds for the rest of this course: an emission factor quoted without its year, its source and its boundary is an unverifiable number.
FAQ
Which grid emission factor should you use for France?
For a French regulatory inventory, the ADEME Base Carbone factor is mandatory under article L229-25 of the French environment code: 0.0461 kgCO₂e/kWh for 2025, smoothed over 2022-2025, with a declared uncertainty of 10%, and 0.0519 for an inventory covering 2024. For comparing several countries it becomes unusable, since it covers one zone only, and you switch to Ember or Electricity Maps applied consistently.
Why are there such different factors for the same country?
Because three independent choices separate them: the geographic boundary, depending on whether you count electricity produced or electricity consumed including imports; the life-cycle boundary, depending on whether you count combustion alone or also construction and fuel upstream; and the per-technology factors used. For France in 2025, those combinations produce eight sourced values ranging from 17.1 to 46.1 gCO₂e/kWh, one of them a market-based residual mix (AIB).
Should a data centre use an average or a marginal factor?
The GHG Protocol reserves the operating margin for demand changes that are discrete, temporary and small, and the build margin for changes that are permanent and large. A data centre of several hundred megawatts falls in the second category. In India, where the CEA publishes all three values (Brazil also publishes operating and build margins), the gap between operating margin and build margin reaches a factor of 1.9, and the build margin is the lower of the two.
How big is the footprint gap between hosting in France and in Poland?
A factor of 14 according to Ember on a production basis with full life-cycle assessment, so 41.4 against 590.9 gCO₂e/kWh in 2025, and a factor of 21 according to Electricity Maps with flow tracing. That order of magnitude holds whatever the database, which is rare in this field, and it makes a solid argument about the choice of hosting region.
Is there an official emission factor for an artificial intelligence request?
No. ADEME's Base Empreinte, which contains the Base Carbone, has no entry for generative AI, LLM requests or tokens, checked on 9 October 2026 against version 1.2. Since May 2026 it offers entries for manufacturing GPUs and servers, without the electricity used in operation. The only public figures are provider self-declarations on incompatible functional units, such as Google's median prompt and Mistral's 400-token answer. So the calculation has to go through a reconstruction in kWh.