Because the GHG Protocol requires two ways of calculating scope 2, and they do not measure the same thing. The location-based method applies the real carbon intensity of the grid where the electricity is consumed. The market-based method applies the purchase contracts.
The gap is not cosmetic. Across Google, Microsoft and Meta combined it comes to 27.6 million tonnes of CO2e, roughly the annual emissions of Ireland.
The two definitions
Emissions calculated with the average factor of the electricity grid in the zone where consumption happens. A data centre in Poland takes the Polish mix, whatever it has signed.
This is physical reality, verifiable by a third party. It is the only method that moves when usage moves.
Emissions calculated from the contractual instruments held: guarantees of origin, direct purchase agreements, renewable certificates. Consumption covered by a certificate counts as zero, whatever the real grid mix.
Three families of instruments, from the most solid to the least. The physical purchase agreement, with delivery from an identified site. The purely financial contract. And the certificate bought separately, decoupled in time as well as in space.
The gap, at the companies carrying the load
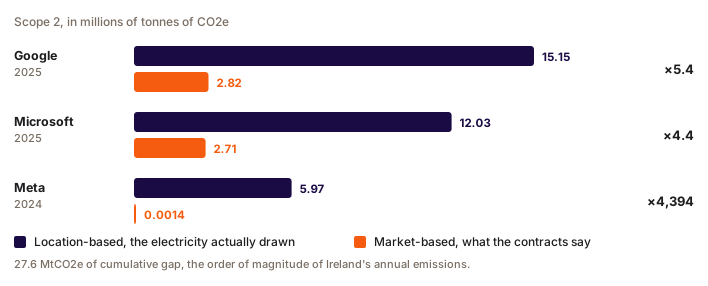
| Company | Year | Location-based | Market-based | Ratio |
|---|---|---|---|---|
| 2025 | 15,148,700 tCO2e | 2,815,000 | 5.4 | |
| Microsoft | FY2025 | 12,030,556 | 2,707,428 | 4.4 |
| Microsoft | FY2024 | 9,955,368 | 259,090 | 38.4 |
| Meta | 2024 | 5,967,348 | 1,358 | 4,394 |
| Amazon | 2025 | not published | 3,740,000 | cannot be computed |
At Google the trajectory says more than the ratio. Between 2024 and 2025, location-based rose 36.9% while market-based fell 2.9%. Data centre electricity consumption went from 30.6 to 42.4 TWh, up 38%.
One curve follows physics, the other follows purchasing. You know which one gets communicated.
The case that proves the point
Microsoft, FY2025. Market-based scope 2 goes from 259,090 to 2,707,428 tonnes in a year, multiplied by 10.4.
No physical degradation of the electricity mix. The cause is written in a footnote of the report: the volumes counted included certificates bought on the spot market, discontinued in February 2025. So the ratio between the two methods drops from 38.4 to 4.4 simply by dropping one accounting instrument. The location-based curve rose only 20.8%.
Empirical demonstration: market-based records a purchase, it says nothing about actual consumption.
The extreme case
Meta, 2024: 1,358 tonnes of scope 2 for the entire group, of which 135 tonnes for all data centres. A hurried reader concludes the company has solved its electricity problem.
Yet Meta publishes the location-based breakdown per site, and that table is the best teaching material on the subject:
| Site | Grid zone | Location-based 2024 |
|---|---|---|
| Altoona (Iowa) | MISO | 666,434 tCO2e |
| Prineville (Oregon) | NWPP | 498,192 |
| Clonee (Ireland) | SEM | 312,427 |
| Henrico (Virginia) | PJM | 255,314 |
| Luleå (Sweden) | SE1 | 5,298 |
A factor of 126 between Luleå and Altoona, same operator, same hardware, same practices. Only the electricity grid changes. That is the cleanest illustration of the "choose your region" lever, and it comes from the provider's own data.
What the research says about certificates
Four publications worth knowing, all peer-reviewed.
Bjørn et al., Nature Climate Change, 2022: strip out the reductions claimed through certificates and the scope 2 trajectories of the companies studied are no longer aligned with 1.5°C, and 42% of the announced reductions will not translate into real mitigation.
Bjørn, Lund and Brander, Environmental Research Letters, December 2024, across 206 companies: under stricter rules, the declared scope 2 reduction drops from 21% to 17%, and the share of companies behind on their target goes from 28% to 50%.
Langer et al., Journal of Cleaner Production, 2024: annual matching produces no significant emissions reduction against a counterfactual with no certificate market, whereas hourly matching with local, additional contracts does.
Brander, Carbon Management, December 2025: the revision under way would still create false claims, and proposes either accepting that market-based is performance accounting, or introducing a causality requirement.
The way out, and its limit
The sector's answer is hourly matching, or 24/7 CFE. Google's overall score reaches around 65% in 2025, against 66% in 2024, so slightly down. Those values and the regional breakdown come from Google's 2026 Environmental Report, data table; no other hyperscaler publishes the equivalent. The regional spread is the real lesson:
| Region | Hourly matching 2025 | Region | 2025 |
|---|---|---|---|
| Finland | 98% | Ireland | 60% |
| Denmark | 92% | PJM (Virginia) | 57% |
| MISO | 88% | Japan | 23% |
| Germany | 70% | Singapore | 5% |
PJM at 57% against MISO at 88%: PJM is the Northern Virginia grid, the largest concentration of data centres in the world. Plenty of compute, little decarbonised electricity available hour by hour.
Question
A client report gives a single scope 2 number, market-based. What do you do?
Choisissez une réponse pour voir l'explication.
Two standards in force, two opposite answers
Few consultants know this point, and it is decisive in a review meeting.
The SCI specification, which became ISO/IEC 21031 in March 2024, requires location-based and forbids market-based, naming certificates, purchase agreements and guarantees of origin explicitly as mechanisms that cannot reduce a score.
The EU data centre reporting framework does the opposite: its renewable share indicator explicitly aggregates purchased guarantees of origin and purchase agreements.
Two published international texts, applicable to the same data centre in the same year, with incompatible definitions. Nothing arbitrates that contradiction, and you need to know about it before claiming a number is compliant.
The position to hold
Always ask for both numbers, and remember that the electricity factor itself depends on three decisions. Recommend location-based by default in internal dashboards, with market-based as a second display. The reason is operational: market-based makes a model on a carbon-heavy grid look as clean as a model on a decarbonised one, which destroys exactly the signal you are trying to send.
And warn people about the timetable. The scope 2 revision consultation closed on 31 January 2026, and publication will be coordinated with another standard whose formal consultation only happens in the third quarter of 2027. Nothing will change before 2028 at the earliest. Clients building a strategy today on unbundled annual certificates should know that the accounting value of those instruments has a limited life, without the date being known.
FAQ
What is the difference between location-based and market-based scope 2?
Location-based applies the average emission factor of the electricity grid where consumption happens, which reflects physical reality. The market-based method applies the electricity purchase contracts held, so that consumption covered by renewable certificates counts as zero. The GHG Protocol requires both to be published and labelled.
How big is the gap between the two methods at the large cloud providers?
It reaches a factor of 5.4 at Google in 2025, 4.4 at Microsoft in FY2025, and 4,394 at Meta in 2024, whose market-based scope 2 falls to 1,358 tonnes against nearly 6 million location-based. Added up across those three companies, the gap comes to 27.6 million tonnes of CO2e. Amazon does not publish a location-based figure.
Why did Microsoft's market-based emissions multiply by ten in one year?
Because the company stopped using certificates bought on the spot market in February 2025. No physical degradation of the electricity mix is involved: the location-based curve rose only 20.8% over the same period. That is the demonstration that market-based records a purchase, not actual consumption.
Do renewable energy certificates really reduce emissions?
Peer-reviewed research doubts it for annual matching. Bjørn et al. estimate in Nature Climate Change that 42% of the scope 2 reductions claimed will not translate into real mitigation. Langer et al. conclude that annual matching produces no significant reduction, whereas hourly matching with local, additional installations does.
Which method should be used for a carbon inventory of AI usage?
Both, with location-based as the default display. Market-based makes a model hosted on a carbon-heavy grid look as clean as one hosted on a decarbonised grid, which removes the signal you need to steer by. Note that ISO/IEC 21031 forbids market-based in its score, while EU data centre reporting includes it, and no text arbitrates between them.