Inference, as soon as a model is widely deployed, in the sense of what each token served costs. But the crossover point depends on how the model is operated, not on its size: it takes between 861 million and 276 billion requests for inference to catch up with training, depending on the model and on how full the servers run.
On one and the same model, going from a saturated service to a service handling one request per second moves that threshold by a factor of 30. And the training figure you read almost never covers more than a tenth of the compute that actually produced the model.
What a published training figure covers
Almost always the final run alone, never the project. DeepSeek states it in its own V3 technical report: "Note that the aforementioned costs include only the official training of DeepSeek-V3, excluding the costs associated with prior research and ablation experiments on architectures, algorithms, or data."
The last training pass, the one the published weights come out of. It follows hundreds of attempts: ablations, scaling laws, hyperparameter sweeps, runs abandoned halfway through.
For a carbon assessment, that is an incomplete numerator: two independent measurements, one in compute dollars, the other in tonnes, both point to a real cost 1.5 to 10 times higher.
Denain and Wu (Epoch AI, 23 March 2026) measure the final run's share of R&D compute, in dollars:
| Lab | Period | Final run's share |
|---|---|---|
| OpenAI | 2024 | around 9.6% |
| Z.ai | H2 2024 to H1 2025 | 12.3% |
| MiniMax | Q4 2024 to Q3 2025 | 22.6% |
Morrison et al. (ICLR 2025, arXiv:2503.05804) land on the same order of magnitude by a different route, publishing all 813 development runs behind OLMo 2, which nobody else does.
| Line item, full OLMo 2 cycle | tCO2eq |
|---|---|
| Hardware manufacturing, amortised over 4 years | 22 |
| Development, 813 runs | 159 |
| Final training runs | 312 |
| Total | 493 |
Verbatim from their abstract: "model development, the impact of which is generally not disclosed by most model developers, amounted to ~50% of that of training".
Emma Strubell goes higher still, at an ENS/OBVIA conference in July 2026: around 82% of compute hours go into trial and error that never gets counted, a factor of 5 underestimate. The order of magnitude matches Epoch AI's by another method, but it comes from a spoken talk, with no paper and no written scope behind it. Cite it as such.
Declared footprints are floors
Meta's model cards are the only ones that publish both accounting conventions side by side. Scope: final pre-training run only, compute hours times nominal power, with no building efficiency, no host processor, no network and no hardware.
| Model | GPU hours | Location-based | Market-based |
|---|---|---|---|
| Llama 2, total | 3,311,616 (A100) | 539 tCO2eq | not published |
| Llama 3, total | 7.7M (H100) | 2,290 tCO2eq | not published |
| Llama 3.1, total | 39.3M (H100) | 11,390 tCO2eq | 0 |
| Llama 3.3 70B | 7.0M | 2,040 tCO2eq | 0 |
| Llama 4, Scout and Maverick | 7.38M | 1,999 tCO2eq | 0 |
The zero comes from an identical sentence on every card since July 2024: Meta covers 100% of its consumption with renewable energy purchases. The chapter on market-based against location-based goes into what that convention actually measures.
The location-based figure, on the other hand, can be checked by division. 39.3 million hours times 0.7 kW gives 27,510 MWh, and 11,390 tonnes over that energy gives 0.414 kgCO2e/kWh, close to the US grid average. The same calculation works on every generation, landing between 0.387 and 0.425: the method is auditable.
That figure still excludes building efficiency, the host processor and hardware manufacturing. So it too is a floor.
The carbon is in the grid, not in the model
The cleanest demonstration comes from the BLOOM paper (Luccioni, Viguier and Ligozat, JMLR vol. 24, 2023). Scope: dynamic consumption of the run, building efficiency included.
| Model | Parameters | Grid intensity | Energy | CO2e |
|---|---|---|---|---|
| GPT-3 | 175B | 429 gCO2eq/kWh | 1,287 MWh | 552 t |
| Gopher | 280B | 330 gCO2eq/kWh | 1,066 MWh | 380 t |
| OPT | 175B | 231 gCO2eq/kWh | 324 MWh | 76.3 t |
| BLOOM | 176B | 57 gCO2eq/kWh | 433 MWh | 30 t |
BLOOM uses more energy than OPT at comparable size, 433 MWh against 324, and emits 2.8 times less. What separates them is the electricity grid where they were trained.
The same paper isolates a line nobody else measures. Over the full life cycle of training BLOOM, 22.2% comes from hardware manufacturing, 48.9% from dynamic consumption, and 28.9% from idle consumption, which is to say from waiting.
The crossover point, quantified
Table 3 of Morrison et al. Protocol: 2,400 ShareGPT prompts served through SGLang on an H100, factor of 0.332 kgCO2e/kWh, building efficiency 1.2. Number of inferences needed for inference to equal training.
| Model | Saturated server | 8 requests/s | 1 request/s |
|---|---|---|---|
| Llama 3.1 8B | 276 billion | 59.5bn | 9.12bn |
| Llama 2 13B | 13.3 billion | 7.52bn | 1.13bn |
| OLMo 2 7B | 20.9 billion | 7.68bn | 1.05bn |
| OLMoE 0924 | 21.7 billion | 3.51bn | 861 million |
The authors' conclusion: "for most models tested, the number of inferences required to outweigh training costs is in the hundreds of millions to tens of billions".
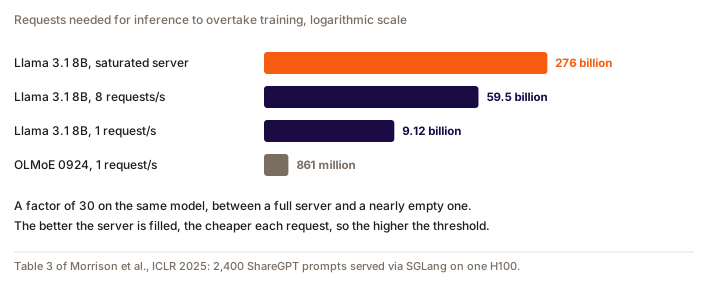
On the Llama 3.1 8B row, the threshold goes from 9.12 to 276 billion requests on server fill alone. A factor of 30, with the model unchanged.
Question
A client self-hosts an 8 billion parameter open source model for internal use, a few thousand requests a day. What do you tell them about the relative weight of training?
Choisissez une réponse pour voir l'explication.
Five figures circulate, none of them measures the same thing
| Source | Figure | Quantity | What it actually covers |
|---|---|---|---|
| Patterson et al., Google | 60% inference, 40% training | energy in kWh | Google's entire ML fleet, R&D included, three one-week samples in April |
| Wu et al., Meta, figure 3a | 70% inference | capacity in megawatts | Facebook's AI infrastructure |
| Wu et al., Meta, language model | 65% inference | operational emissions | one model, window set to the length of training |
| Wu et al., Meta, recommendation model | 40% inference | energy, data phase included | one recommendation model |
| AWS, December 2019 blog post | "up to 90%" | dollars | customer self-reporting, upper bound, product launch post |
That is five units, four objects and three time windows. These numbers do not add up.
Two corrections worth spreading. Google's famous 60/40 covers three weeks in April, in 2019, 2020 and 2021, across the entire machine learning load of a search engine, before ChatGPT. Quoting it as the split for a language model gets both the scope and the date wrong.
And the "80 to 90% inference" regularly attributed to NVIDIA has no primary source. Checked against the manufacturer's own product pages: the figure is not there. The citation chain goes back to a 2019 article with nothing at the end of it. Do not repeat it.
What is established: the UNU-INWEH 2026 report puts inference at 80 to 90% of AI's total consumption, and Arcep declines to settle it, since the answer depends on the model, on how often it is retrained and on the number of users.
What this changes for a carbon assessment
You divide the total training footprint by the number of tokens served over the model's life, then add that quotient to each request. Standard life cycle assessment logic.
The alternative is marginal cost only: you count only the extra compute the request caused, and training becomes a sunk cost that appears nowhere.
What the field actually does:
| Organisation or standard | Amortises? | What it writes |
|---|---|---|
| Google, arXiv:2508.15734 | No | "We leave the measurement of AI model training to future work." |
| Mistral, July 2025 LCA | No | refers to "marginal impacts of inference", and calls for the missing indicator itself |
| SCI for AI, Green Software Foundation | No, on principle | rejects amortisation on the grounds that the consumer has no control over how the model was trained |
| ITU-T L.1801, February 2026 | Yes | pro rata allocation across inferences over the model's life |
The two most recent texts in the field contradict each other head-on. A consultant who says you must amortise, or that you must not, is wrong either way: the question has not been settled, and the job is to say what you did and why.
The problem is in the denominator. Nobody publishes the number of tokens served over a model's lifetime, so amortisation stays undecidable from outside, however good the training figure is.
FAQ
Does training an AI model pollute more than using it?
It depends entirely on volume served. Morrison et al. (ICLR 2025) put the crossover between 861 million and 276 billion requests, depending on the model and on how full the servers run. Below that threshold, amortised training dominates. Above it, inference wins. The UNU-INWEH 2026 report puts inference at 80 to 90% of AI's total consumption at sector scale.
What does a provider's published training figure actually cover?
The final run alone, almost never the full project. Epoch AI measures that run at 9.6% of research compute at OpenAI in 2024, 12.3% at Z.ai and 22.6% at MiniMax. Morrison et al. separately measure development at around 50% of the final run, in tonnes. The real numerator is therefore 1.5 to 10 times higher than the headline figure.
Why does Meta declare zero tonnes for training Llama?
Because it publishes two figures. The first, location-based, is 11,390 tonnes of CO2e for Llama 3.1 and corresponds to the electricity actually drawn from the grid. The second, market-based, is zero because the company covers 100% of its consumption with renewable energy purchases. Both are correct within their own accounting convention.
Do two models of the same size have the same training footprint?
No, and the gap comes mostly from location. BLOOM and OPT are both around 175 billion parameters. BLOOM used more energy, 433 MWh against 324, and emitted 2.8 times less, 30 tonnes against 76.3, because it was trained on a grid at 57 gCO2eq/kWh against 231. The deciding factor is the electricity mix, not the architecture.
Should training be amortised across every request in a carbon assessment?
There is no consensus. ITU-T recommendation L.1801, from February 2026, requires pro rata allocation across inferences. The Green Software Foundation's SCI for AI standard explicitly rejects it, on the grounds that the consumer does not control how the model was trained. Google and Mistral both leave it out of their published figures. In practice, since the number of tokens served over a model's life is never published, amortisation stays undecidable from outside.