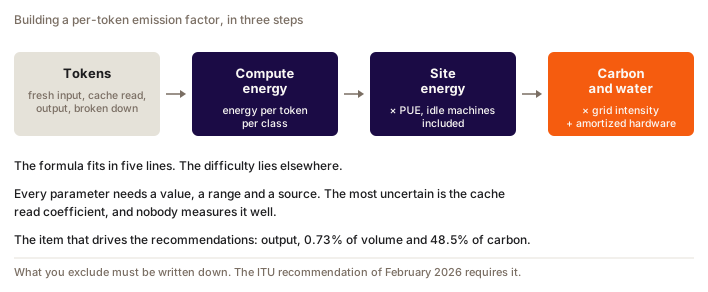
Three steps. Token volume gives you an IT energy figure, that energy becomes the total site energy, and from there you get carbon and water.
The formula is five lines long, so that is not where the difficulty sits. The hard part: choosing each parameter, declaring what you exclude, and accepting one counter-intuitive fact. On agentic use, output accounts for 0.73% of volume and 48.5% of carbon.
The formula
Units are written on every line. That is what lets you spot a formula found elsewhere that does not close.
Block 1, from volume to IT energy.
E_IT = T_input × e_in   +  T_cache × e_in × f_cache  +  T_output × e_out
kWh  = tokens × kWh/tk  +  tokens  × kWh/tk × (none) +  tokens  × kWh/tk
e_in and e_out are the unit energies, in kWh per token, measured on the serving hardware. Order of magnitude on an H100 at batch size one: 6.05 × 10⁻⁸ kWh per input token against 2.13 × 10⁻⁶ kWh per output token, hence the factor of 35 between them.
f_cache is a dimensionless ratio: the fraction of a fresh input token's energy that a token re-read from cache still costs. Value used here is 0.08, published range 0.05 to 0.20.
Block 2, from IT energy to total energy.
E_total = E_IT × PUE
kWh     = kWh  × (dimensionless)
Block 3, from energy to impacts.
CO2e     = E_total × CIF        +  E_IT × EMB
gCO2e    = kWh     × gCO2e/kWh  +  kWh  × gCO2e/kWh

Water    = E_IT × WUE_site  +  E_total × WUE_upstream
litres   = kWh  × L/kWh     +  kWh     × L/kWh
Two unit traps, both seen on real engagements. EMB applies to IT energy, not to total energy: manufacturing carbon belongs to the accelerators, not to the chiller. And WUE_site applies to IT energy while WUE_upstream applies to total energy, because the water used to generate electricity follows everything the site draws from the grid.
If you want the per-token factor rather than the total, divide the carbon line by the token count and you get gCO2e/token. That is the number that stays comparable over time, where a per-request number ages badly.
The grams of CO2e emitted to produce one kilowatt-hour on the electricity grid where the compute runs. In 2025, roughly 41 g in France, 384 in the United States, 591 in Poland, 459 as a world average.
This is the only term that depends on the country, and picking it takes three decisions. All the others are properties of the hardware or of how the site is run.
The manufacturing carbon of the hardware, amortised over its lifetime and brought back to the IT kilowatt-hour. A board of eight H100 accelerators carries 1,312 kgCO2e of manufacturing, 42% of it in the memory alone (NVIDIA HGX H100 PCF, July 2025, ISO 14067, cradle-to-gate, no uncertainty interval given).
This term does not depend on the electricity grid. The cleaner the mix gets, the more it dominates the result.
The composite, and what moves when you change country
Blocks 2 and 3 collapse usefully on the carbon side:
K_co2 = PUE × CIF + EMB
Worked through on real values, those of the claude-carbon / TokenClimate methodology. PUE of 1.14, the AWS fleet value declared for 2025, so an operator average and not the PUE of a named site. CIF of 287 gCO2e/kWh, the intensity of the AWS region attributed to Anthropic by Jegham et al. in version 5 of the paper; version 4 gave 385 g, and nobody else publishes the hosting region. EMB of 44 g per IT kWh, hardware amortised. That gives 1.14 × 287 + 44 = 371 gCO2e per kWh.
CIF is the most fragile parameter here: it rests on a region inferred by a third party rather than declared by the provider, and it moved by 25% between two versions of the same paper. Publish it with its version and its review date.
Switch CIF to France, 41.4 g per Ember, and you get 91.2 g. A factor of 4.1 on the composite, and 6.9 on the use-phase component alone. Not 20, as you sometimes hear.
A cleaner grid means the hardware weighs more in the total. At zero carbon intensity the composite does not go below 44 g. The same pattern shows up elsewhere: the life-cycle assessment of Lucie 7B (arXiv:2607.05408, July 2026) measures, on the H100 partition of the Jean Zay supercomputer running off the French grid, an annual footprint of 417.5 tCO2eq split "almost equally between manufacturing and operation".
Corollary for your meetings: arguing about PUE is quibbling over 5%. Arguing about CIF moves the result by a factor of 8. Steer the discussion accordingly.
What the formula leaves out, and what that costs
Block 1 keeps two of the three coefficients published by Delavande, Pierrard and Luccioni. It drops the third, the cross term, which counts the re-reading of the KV cache at every token produced.
The paper's full model, with its homogeneity check:
E   = A × T_input   +  C × T_output  +  D × T_context × T_output
Wh  = Wh/tk × tk    +  Wh/tk × tk    +  Wh/tk² × tk × tk

A = 6.05 × 10⁻⁵ Wh/token     C = 2.13 × 10⁻³ Wh/token
D = 2.87 × 10⁻⁷ Wh/token²
Why we drop it. D comes from a single fit, on a single model in FP32, a single H100, at batch size one. No publication gives it for any other configuration, and certainly not under batched production serving. Applying it to a shared service would mean carrying a measurement outside its domain of validity, which is exactly what this course criticises everyone else for.
What the omission costs. It is not neutral and it always goes the same way, towards underestimation. At batch size one, the cross term is worth roughly 10% of the energy on a short chat, 46% on a long chat, and 68% on an agent session carrying 126,180 tokens of context. On that last profile it becomes the largest item and the output term falls to 4%.
It is also not the same object as block 1's cache factor. f_cache is a prefill residue, counted once per request. The cross term is a decode cost, counted once per token produced. Both describe the same re-reading seen from two different phases, and adding them is not double counting.
MISSING DATA. Nobody has refitted the three coefficients across several batch sizes. It is the most awkward hole in the method, because it sits on the dominant term of the one profile that is growing, agentic use. Protocol to close it: take the Delavande et al. protocol, same model and same hardware so the results stay comparable, and rerun the fit at batch sizes 1, 8, 32 and 128, sweeping context length over at least two orders of magnitude. Publish the three coefficients per batch size, together with the matching C/A ratio.
Until that work is done, the defensible position is this one: the formula holds for chat, it underestimates agentic use, and the size of the underestimation is known at batch size one only.
The most uncertain parameter
On agentic use, cache re-reading accounts for most of the volume. So f_cache becomes structural, and nobody measures it well.
The fraction of a fresh input token's energy that a token re-read from the prompt cache still costs. Value used by the TokenClimate methodology: 0.08, published range 0.05 to 0.20.
This factor models what is left of prefill. It has nothing to do with generation. Naming the physical term correctly stops you steering future revisions the wrong way.
The only direct measurement available, Irminsul (MLA-Native Position-Independent Caching, arXiv:2605.05696), compares the energy of a cache hit and a cache miss through NVML counters, on a 4,096-token prefix:
| Attention architecture | Miss | Hit | Ratio |
|---|---|---|---|
| GQA, Qwen3-32B | 262.3 J | 37.5 J | 14% |
| MLA, DeepSeek-V2-Lite | 47.1 J | 17.2 J | 37% |
| State-space models | n/a | n/a | 0% |
Why 0.14 was not adopted despite being the more recent measurement: the protocol runs at a 4,096-token prefix when the median step of a coding agent carries 126,180. At that scale the fixed startup costs that dominate small cases get amortised and the real ratio drops, something the authors acknowledge themselves.
Behaviour worth copying. A factor measured outside its domain of validity does not become good because it is recent. You widen the published range rather than move the central value.
The breakdown that changes the recommendations
Breakdown measured on the claude-carbon agentic session base, 17,402 million tokens from January to August 2026:
| Token class | Share of volume | Share of carbon |
|---|---|---|
| Output | 0.73% | 48.5% |
| Cache reads, factor 0.08 | around 90% | 22.7% |
| Fresh input and cache writes | around 9% | 28.8% |
Three readings of a single table.
A tool that counted every cache read at the price of a fresh input token would show 5 to 10 times more. That is how far off a single-counter dashboard lands.
The genuinely compressible share is worth 28.8%, so a perfect compressor would not get below 71% of the total. With the top of the cache factor range, that floor rises further.
What moves the needle acts on output, under one per cent of volume and close to half the carbon. A smaller model. Reasoning switched off. And above all, shorter answers.
This profile belongs to agentic use. On plain chat, roughly 1,000 input tokens for 150 generated, input is worth about 16% of the energy and compression has far more purchase. Always say which profile a percentage was computed on.
Question
On a coding agent, which lever do you put first in your recommendations?
Choisissez une réponse pour voir l'explication.
Existing methodologies, and what they cover
| Method | Hardware | PUE | Idle | Network | Training |
|---|---|---|---|---|---|
| Google, 2025 | yes | yes | yes | no | no |
| EcoLogits | yes, over 3 years | yes | no | no | no |
| LLMCarbon | yes | yes | not explicit | no | yes |
| ML CO2 Impact | no | no | no | no | n/a |
| SCI, ISO/IEC 21031 | yes | via energy | depends on the unit | depends on energy | free unit |
The formula standardised by ISO fits on one line, SCI = (O + M) per R, where O is energy multiplied by carbon intensity, M is amortised hardware, and R is the functional unit. R is the free parameter, and therefore the first source of non-comparability: two compliant scores computed with different R cannot be compared.
Two properties set this framework apart from classic reporting. It excludes offsets by construction, since it measures a rate and not a total. And its energy term has to cover reserved hardware, not just hardware in use, which changes everything on an under-loaded fleet.
What to publish alongside the number
A factor is only defensible if it is documented. The minimum, as required by the ITU recommendation of February 2026: system description, functional unit, boundaries with justified exclusions, sources and quality of the factors, energy split between training and inference, and a statement of full or partial conformity with the exclusions spelled out.
"Partial conformity with explicit exclusions" is what an honest methodology can deliver today, and no more. It is also the only defensible position, since no binding standard imposes a method.
To apply all of this to real usage without starting from scratch, the TokenClimate methodology publishes its parameters, their ranges and their sources, and the calculator runs the formula across a mix of models.
FAQ
How do you calculate the carbon footprint of LLM usage?
In three steps. First convert token volume into IT energy, separating fresh input, cache reads and output, each with its own coefficient. Then multiply by the site PUE to get total energy. Finally apply the carbon intensity of the electricity grid involved, plus a term for the embodied carbon of the amortised hardware.
How much weight should cached tokens get?
About 0.08 times the energy of a fresh input token, within a published range of 0.05 to 0.20. The only direct measurement available gives 14% to 37% depending on the attention architecture, but it was taken on a 4,096-token prefix when an agent session carries around 126,000, a scale at which the real ratio drops.
What share of the footprint comes from output tokens?
On agentic use measured over 17 billion tokens, output is 0.73% of volume and 48.5% of carbon. Cache reads are around 90% of volume for 22.7% of carbon. On plain chat the split is very different and input is worth about a quarter of the energy.
Does changing hosting country divide the footprint by 20?
No. On a typical composite, moving from a US carbon intensity to a French one gives a factor of 4.1 on the total and 6.9 on the use-phase component alone. PUE and the embodied carbon of the hardware do not move with the country, and the second becomes dominant as the grid decarbonises.
Is there a standard for calculating the footprint of an AI request?
No binding standard imposes a method. The SCI specification, which became ISO/IEC 21031 in 2024, provides a formula but leaves the functional unit free and never mentions inference. ITU-T Recommendation L.1801 of February 2026 is the most complete, without being binding. The defensible position is to declare your boundaries and your exclusions.